It is what it is. Objectively analyze mobility behavior.
Be it data from smartphone tracking, from classic surveys, sensor data or data generated from other measurements: the TRAFF-X analysis tool is used to interpret traffic situations and to evaluate and visualize data on mobility behavior.
Because there is a wide variety of survey data - but often the overview is missing. The TRAFF-X analysis tool integrates all of your data that is required for analysis for the first time. Data from different sources and diverse structures can be included in the data analysis pool and evaluated together. The best way to derive connections and explanations for mobility behavior is to combine mobility data with statistical data, data on (traffic) infrastructure or spatial structure.
In TRAFF-X, the data is made available in such a way that you can clearly benefit from their combination and are able to make the special statements you want yourself. This means you can use a comprehensive and flexible tool for a wide range of mobility-related questions: to visualize situations, to explain problems, to identify connections, or to derive recommendations for transport measures.
A wide range of questions can be answered, such as which factors most influence the choice of transport for a specific target group (e.g. schoolchildren), or what effect changes to the infrastructure have.
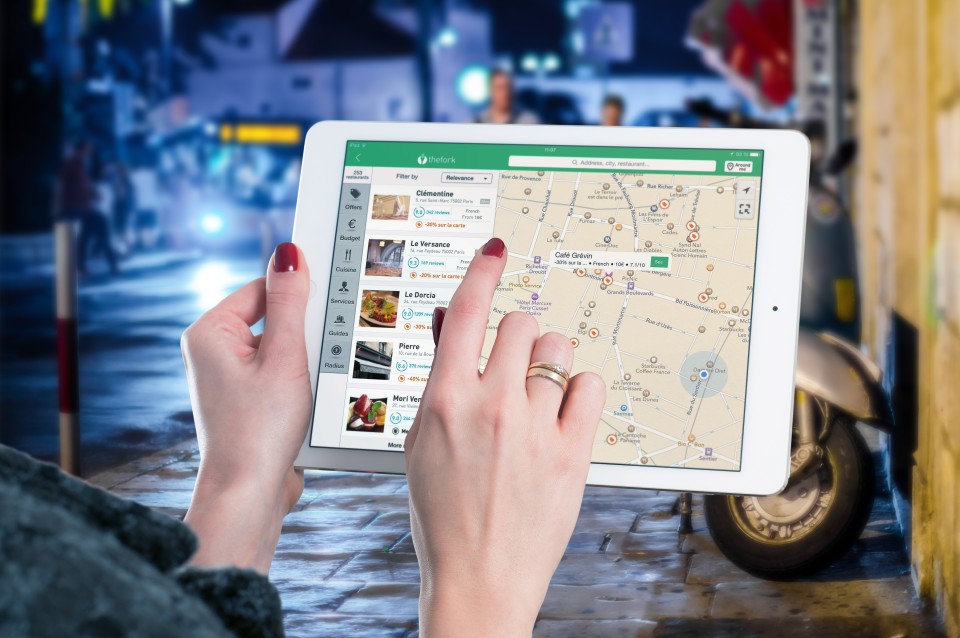
The evaluation results are output as reports, diagrams, and map layers.
You can do this as part of the mobility data analysis.
Integration
Combine data according to your specific questions.
The open architecture of the TRAFF-X analysis tool allows you to integrate data from a wide variety of sources. The selection, formatting and orientation of the data is entirely up to you. Passenger counts, sensor data, floating car data, data from past or current surveys or household and infrastructure data are just some of the examples given here as inspiration.
Analysis
Use configurable analysis methods to evaluate mobility data.
By incorporating and utilizing existing data and combining it with survey data, you can gain new insights and make additional statements.
Data to be included includes, for example:
Survey data: personal data, household data, data on the availability of means of transport, preferences or assessments.
Tracking data: stages, routes, means of transport, activities, locations, campaigns
Alternative mobility data: commuter data, traffic counts, parking space utilization, people getting on and off public transport, car sharing, micro-mobility (MDS), previous surveys, requests to information platforms, traffic models (matrices) or weather data
Data on spatial structure or accessibility: administrative boundaries, population statistics, business locations, school locations, central locations, POI, transport infrastructure, road network, public transport lines and stops, timetables, parking spaces, P&R, sharing locations
Evaluation
The evaluation client is used for this purpose.
Evaluate data professionally according to your requirements. Comprehensive analysis options, filters and aggregation options are available to you.
The results are presented in configurable diagrams and maps. This creates the ideal basis for supporting your decisions.
You can convey the evaluation results transparently and comprehensibly to your target group.
We show how you can shape the mobility of tomorrow with PRISMA solutions today: concrete use cases with TRAFF-X in the area of evaluating mobility surveys.
|
|
Smartphone-based mobility surveys have the advantage over conventional methods that they automatically record all routes and fully capture mobility patterns including route chains. In demand-oriented transport, which is characterized by high flexibility and multimodality in everyday life, short distances and frequent changes of means of transport are the order of the day - as is the case in a metropolitan region in Germany. The task of a smartphone-based mobility survey was to analyze the integration of a shared taxi service into regional mobility events. |
|
|
A mobility survey carried out during an international conference in cooperation with the organizer was intended to show whether the conference lived up to its reputation as a "green event". As part of the smartphone-based survey, the routes taken by conference guests before and during the conference were recorded. The results were presented during the event, showing highly relevant analyses as they were based on the most recent movement data. Around three quarters of the participants traveled to the conference by public transport, bicycle or on foot. A total of 647 routes or 1489 stages with a total length of 23,749 km were recorded. |
||
|
Mobility data was recorded over several months in the central area of an Austrian federal state. The longitudinal section of the data shows changes in mobility behavior over time and thus allows more in-depth statements than the snapshot of a conventional survey. A total of 13,464 routes with a total length of 183,003 km were recorded. TRAFF-X.solutions were used for the diverse data analysis options. |
Contact