Proving rather than presuming: A retrospective with evidentiary weight.
Whether the data comes from surveys, sensors, or other measurements, TRAFF-X serves as a central data hub. It enables you to interpret traffic situations, analyze and interpret mobility patterns, and verify the actual impact of specific events and measures.
Traffic-related data comes in many forms, yet a comprehensive overview is often lacking. TRAFF-X integrates all the data required for your analysis, allowing information from diverse sources and structures to be combined in a single pool for joint evaluation. This enables you to identify patterns and explanations regarding mobility behavior, correlate mobility data with statistics and information on (transport) infrastructure or spatial structures, and generate significant added value in your findings.
Following the implementation of a measure or the conclusion of an event, you can compare and evaluate their impact on traffic conditions—objectively and based on facts, regardless of whether the outcome is positive, negative, or neutral. This allows you to answer questions such as: Which factors have the greatest influence on traffic conditions? What impact did infrastructure changes have? And was the measure taken the right one?
Analysis results are presented as reports, charts, and map layers—prepared to be transparent and easily understood by your target audience.
That's what you can achieve when analyzing mobility data using TRAFF-X.
Information
Use currently generated traffic data or data from other sources.
Using survey data combined with third-party data tailored to the specific issue, you can answer the questions relevant to you with the TRAFF-X analysis tools.
Integration
Combine data according to your specific questions.
By integrating and leveraging existing data—and cross-referencing it—you gain new insights and derive additional conclusions.
Analysis
Use configurable analysis methods to evaluate mobility data.
You can compare and evaluate the effects of measures after their implementation or the conclusion of an event, thereby determining the impact they have had on traffic conditions.
Configurable analysis methods are available for this purpose, allowing you to tailor the analysis to your specific questions—ranging from a single critical location in the network to longitudinal studies spanning months or years.
Evaluation
Professionally analyze data according to your requirements.
Comprehensive analysis capabilities, filters, and aggregation options are at your disposal.
Results can be displayed in configurable charts and maps, providing an ideal foundation for substantiating your decisions. You can present the analysis findings to your target audience in a clear and understandable way.
Effectiveness
Demonstrate and substantiate effects.
You have the opportunity to objectively demonstrate the impact that specific events or implemented measures have had on traffic—whether positive, negative, or neutral.
In doing so, you close the planning loop: what was estimated beforehand is verified after the fact—and the insights gained improve the next decision.
Traceability
Back up decisions.
With numerous display options—including maps, charts, and lists—you can visualize the suitability and rationale of implemented measures, thereby substantiating them with facts.
This also makes it possible to demonstrate to policymakers, supervisory bodies, and the public why a measure was taken and what impact it has achieved.
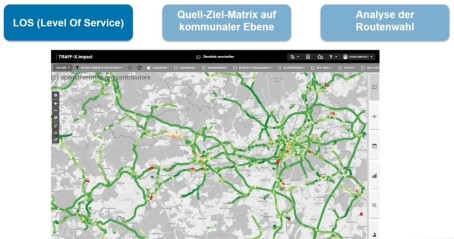
Using concrete use cases with TRAFF-X, we show you how to shape the mobility of tomorrow—starting today—in the field of traffic data evaluation and analysis.
|
|
|
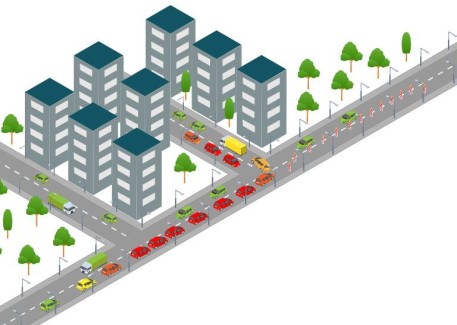
A major city analyzes traffic volume (travel times, congestion durations), identifies critical bottlenecks, and derives measures from this to improve the traffic situation. |
|
|
Understand and optimize traffic with the SmartTrafficAnalyzer: it optimizes traffic management planning processes and offers comprehensive, objective analysis of issues, identifies potential solutions for problem situations, and provides consistent assessment of traffic-related and environmental impacts. |
|
|
|
In demand-responsive transport—characterized by high flexibility and multimodality in daily life—short trips and frequent changes of transport mode are the norm, just as they are in a German metropolitan region. Smartphone-based mobility surveys offer the advantage of automatically recording all trips and comprehensively capturing mobility patterns, including trip chains. The task involved analyzing the integration of an on-demand shared taxi service into the regional mobility landscape. |
|
|
|
Mobility data were collected over a period of several months in the central region of an Austrian federal state. The longitudinal nature of the data reveals changes in mobility behavior over time, thereby allowing for more in-depth insights than the snapshot provided by a conventional survey. In total, 13,464 trips covering an aggregate distance of 183,003 km were recorded. TRAFF-X analysis tools were used to facilitate a wide range of data analysis options. |

Contact